This blog is about the Perfect Dead Cat Bounce Analysis pattern on the Indian stock DHFL (Dewan Housing Finance Limited), As the shares of DHFL crash 55% on bond default concerns on Sept 21,2018.
What this blog will tell you?
This is about to understand THE DEAD CAT BOUNCE pattern, and how you can trade this pattern professionally, whenever you spot this next time.
UNDERSTANDING WHAT IS DEAD CAT BOUNCE
The name “dead-cat bounce” comes from the behavior of a stock after an
unexpected negative event. In this the Negative catalyst was the “Bond Default by the Company”.
UNDERSTANDING TECHNICALS

As you can see DHFL fall from 618 to 274 on a single day on a Negative catalyst, which is a 55% fall on a single day. But the decline was not over and it fall further to 80 in the next 6 months.
HOW TO TRADE IT?
Catching the falling knife can be very scary and can lead to blood bath. Anyway the Patience and discipline can lead to good entry always and this pattern always gives the second chance which you can enter on the pullback to short the stock with the help of Fibonacci levels. which you can see in the below chart.
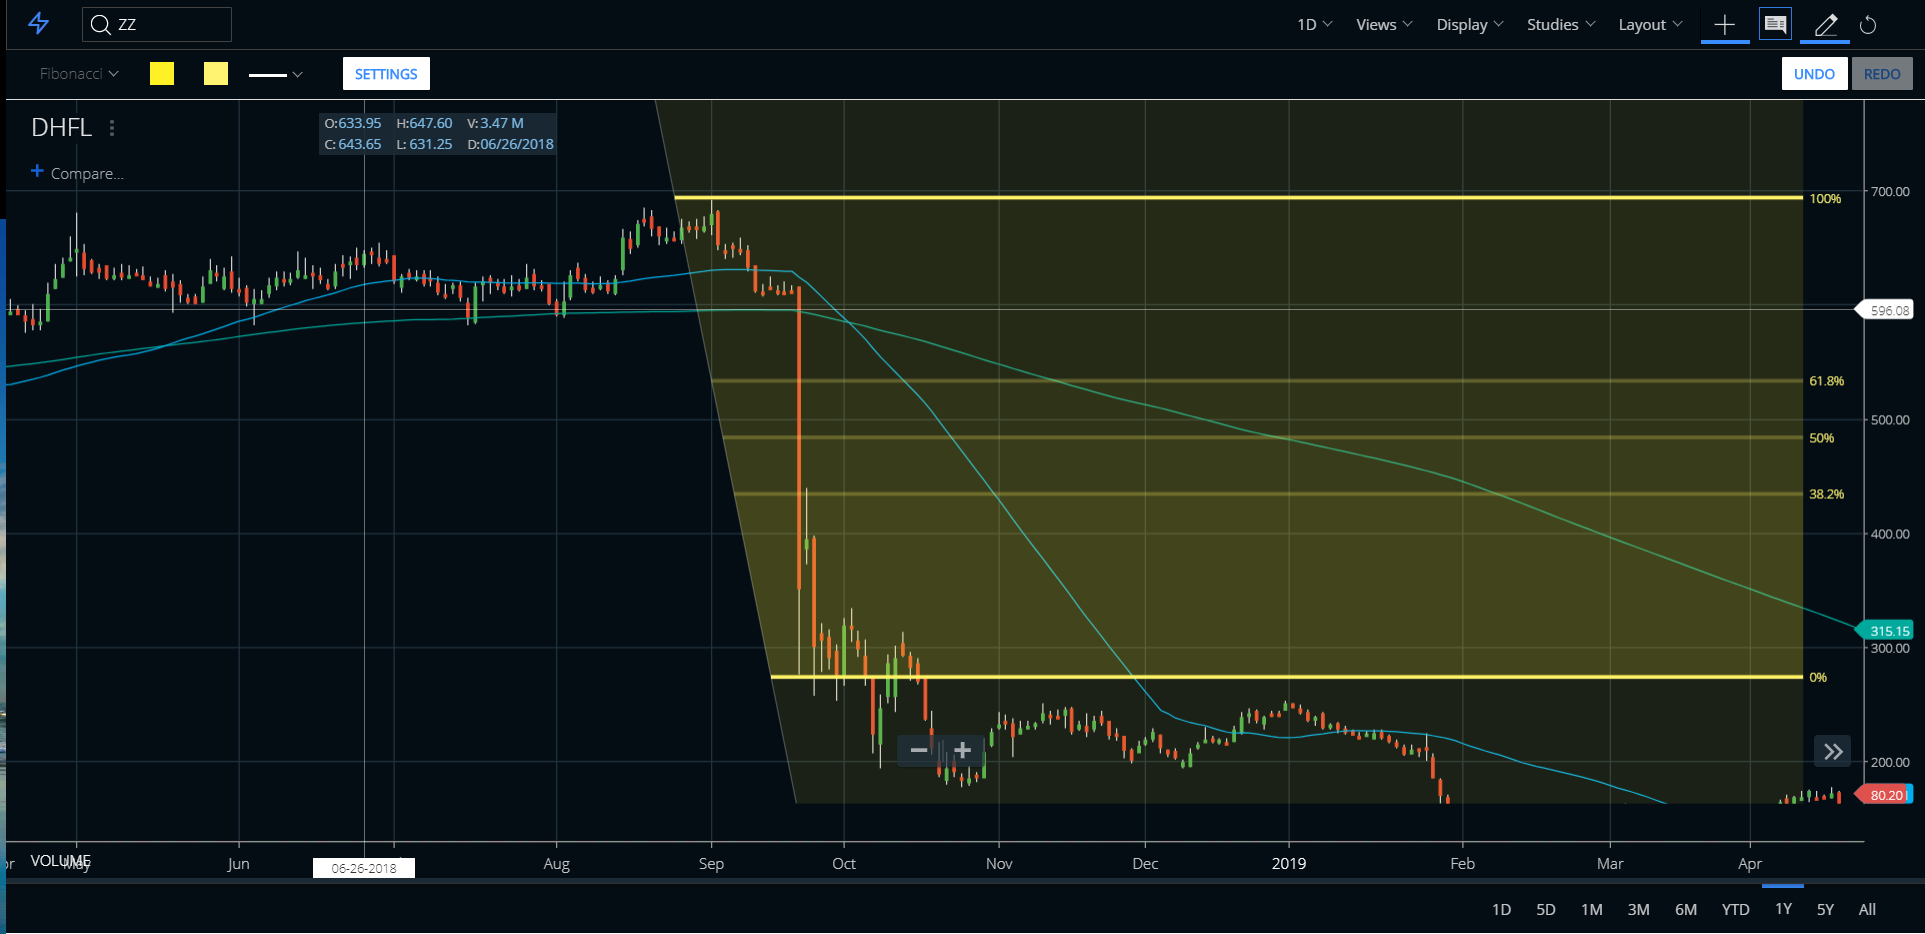
After drawing the Fibonacci levels the stock had the perfect bounce at the 38.2% levels, this is the perfect price level to enter the position to short the stock. This bounce happens because the bargain hunters began buying what they then perceived to be cheap stocks.
Where is the Bounce?
In the Image below, the candle formed after the big red candle on 2nd day is the bounce area.

Playing dead cat bounces allows you to capitalize on other people’s inability to trade wisely, as they amateurishly go after cheap stocks at the wrong time. Almost always, stocks are priced low for a reason—usually a very good reason. These types of stocks should be avoided in most instances as potential long setups. Understanding how to play violent contratrend rallies is something that should be left to a very skilled professional.
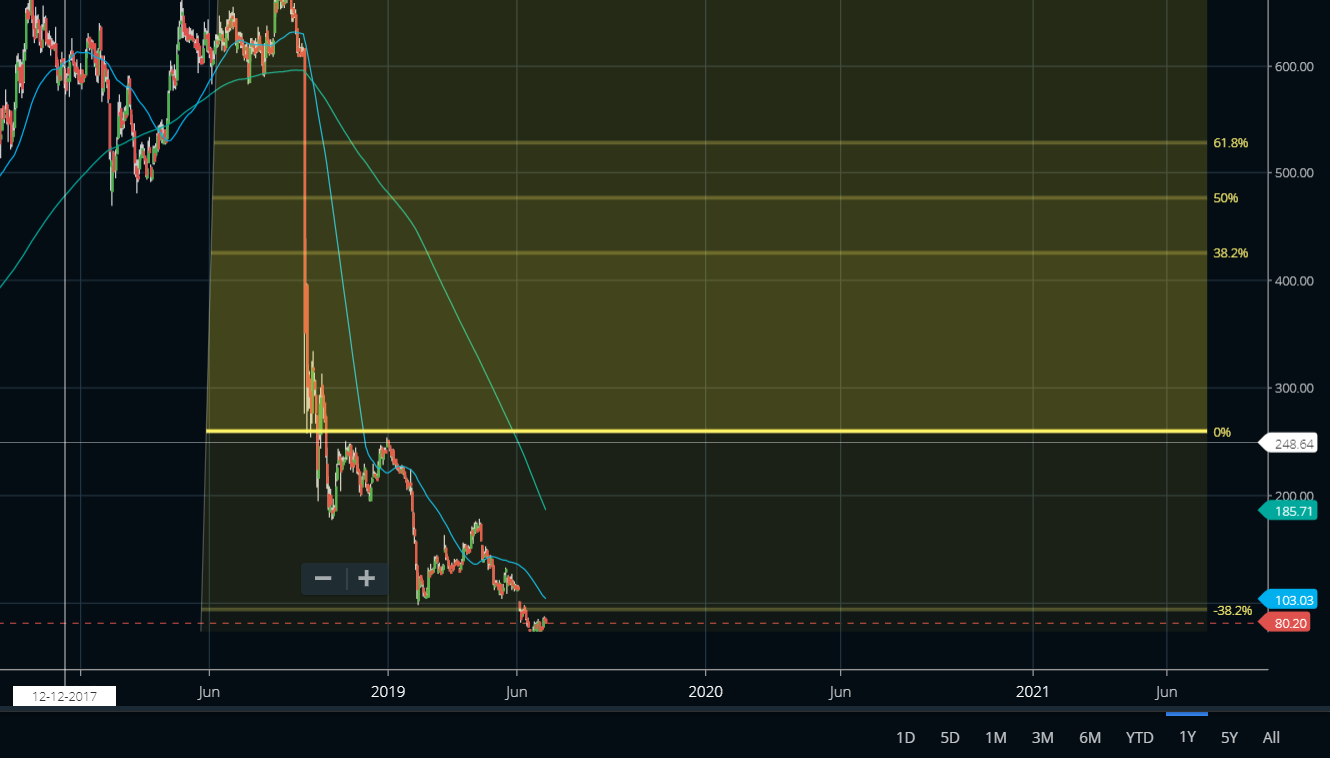
Also you can always predict successfully the next price level of the stock as I have predicted which is the -38.2% as shown in the image below.
Also for the perfect entry’s,these indicators can be used, a Negative MACD pullback, and a Detrended Oscillator reading that shows the oversold condition is over . These indicators shows that the oversold condition has worked its way off before going short.
